South Dakota Mines RAMADDA Data Repository Login Help |
|
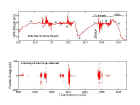
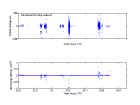
Figures for Flight 761: (a) The side view shows the vertical Ez field component along the airplane's path. The labels a, b, c, d, etc., are used just to mark the time or position for convenience. For example, point b corresponds to a time about 23.9 UTC, which can be related to a point of the airplane track at the same time. From point (or time) b to c, a strong Ez field is measured and the Ez changes its magnitude and sign rapidly due to the lightning flashes or charge distribution variations. (b) The particle charge panel shows when and how many charged particles are encountered and how large is the charge on a particle along the path (or time) of the airplane. For example, most of the time, the airplane measured a mixture of positive and negative charged particles. (c) The net charge panel shows the net charge density along the airplane path. It is calculated by evenly dividing the total path into 5 seconds segments, then for each segment add all charged particle's charge together and divide the sum by the sample volume of the HVPS charge sensor. Each point shows the averaged charge density in that 5 seconds segment. At about 23.2 UTC, the data shows that the airplane goes into a negative charge region. (Please click on the thumbnails of the pictures to view a full resolution image. You should be able to use your "Back" button to bring you back to this page.)
|