South Dakota Mines RAMADDA Data Repository Login Help |
|
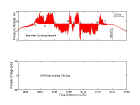
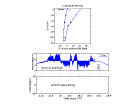
Figures for Flight 750: (a) The side view shows the vertical Ez field component along the airplane's path. The labels a, b, c, d, etc., are used just to mark the time or position for convenience. For example, point b corresponds to a time about 01:00 UTC which can be related to a point of the airplane track at the same time, and at this point Ez field changed from positive to negative. (b) The particle charge panel shows how many charged particles are encountered and how large is the charge o a particle along the path (or time) of the airplane. Since the airplane did not fly through any clouds, no cloud particles were measured. (c) No net charge data is available for this flight. (Please click on the thumbnails of the pictures to view a full resolution image. You should be able to use your "Back" button to bring you back to this page.)
|